Last Updated: July 2026 | Reading Time: 11 minutes
Quick Answer: AI-powered data analytics is the use of machine learning algorithms to find patterns, make predictions, and generate insights from data without requiring you to know exactly what you are looking for beforehand. Traditional analytics answers “What happened?” AI analytics answers “What will happen?” and “Why did it happen?” Tools like Google Analytics 4, Tableau with Einstein, and Microsoft Fabric now include built-in AI features that were once only available to data scientists.
When I First Opened Google Analytics 4
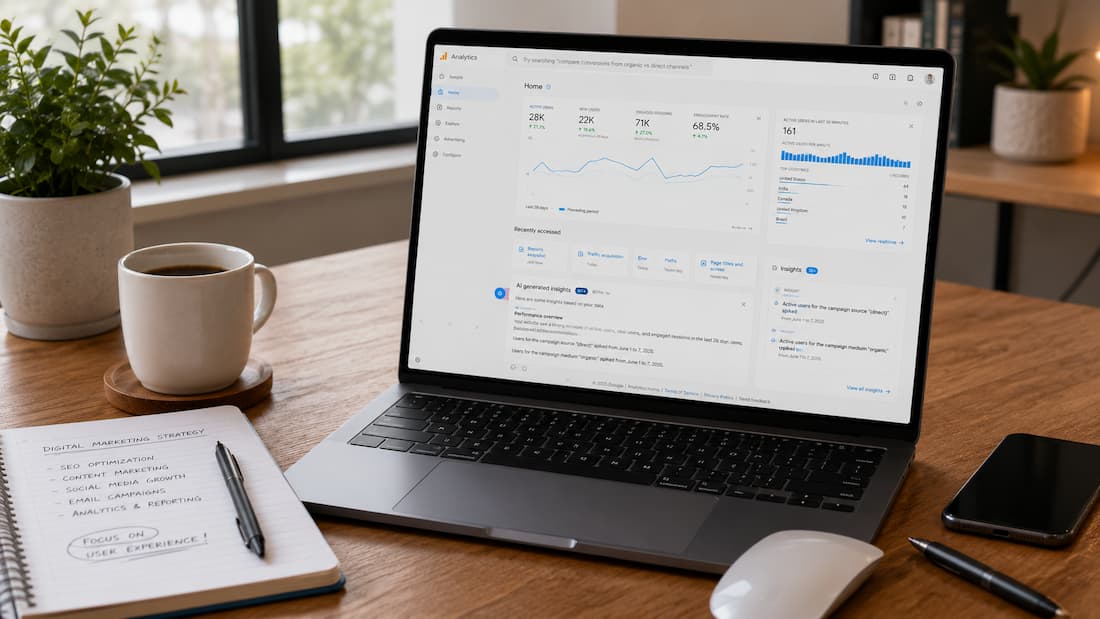
I will be honest. The first time I opened Google Analytics 4, I stared at the dashboard for twenty minutes without understanding a single metric. Sessions, bounce rate, engagement time, event count — the numbers were there, but I had no idea what action to take based on them. I could see that my website had 1,200 visitors last month. So what? Was that good? Bad? Normal? I had no context.
That was in 2023. I was running a small blog about productivity tools. I knew I needed data to grow the site, but traditional analytics felt like reading a foreign language. I would open the dashboard, feel overwhelmed, and close it. Rinse and repeat for months.
Then GA4 introduced its AI-powered insights feature. It started surfacing sentences like “Your organic traffic dropped 23% last week compared to the previous week” and “Users from mobile devices spend 40% less time on your pricing page than desktop users.” These were not just numbers. They were interpretations. They told me what to pay attention to.

That was my entry point into AI-powered analytics. Not a course. Not a certification. Just a tool that finally spoke to me in plain English instead of spreadsheets.
This article is for anyone who feels the way I did. You know data matters. You have access to it. But you do not know where to start or what to do with it. AI analytics is the bridge between raw data and actual decisions.
Traditional Analytics vs. AI-Powered Analytics
Before understanding AI analytics, it helps to understand what it replaces or enhances.
Traditional analytics is reactive. You define a question — “How many visitors did I get last month?” — and the tool gives you an answer. This works fine for straightforward questions. But it has two major limitations.
First, you need to know what questions to ask. If you do not know that mobile users behave differently from desktop users, you will never think to ask about it. The insight stays hidden.
Second, traditional analytics struggles with complexity. If you want to know which combination of factors — traffic source, time of day, device type, and landing page — predicts whether a visitor will subscribe to your newsletter, you are looking at dozens of variables interacting in ways that are hard to untangle manually.

AI-powered analytics addresses both problems. It does not wait for you to ask the right question. It scans your data for anomalies, trends, and correlations, then surfaces the ones that matter. It also handles complexity by running statistical models across all variables simultaneously, finding patterns that would take a human analyst hours or days to uncover.
Here is a concrete example from my own experience. My blog had a post about email management that consistently ranked on page two of Google search results. Traditional analytics told me it got 200 visits per month. That was the number. AI analytics in GA4 told me something else entirely: “Users who find this article through organic search are 3.2 times more likely to return within seven days than users who find it through social media.”
That insight changed my strategy. I stopped promoting that article on social media and focused on improving its search ranking instead. Three months later, it was on page one, getting 800 visits per month. The AI did not just show me data. It showed me where to invest my limited time.
What AI Analytics Actually Does
The term “AI analytics” covers several distinct capabilities. Understanding them separately helps you know what to expect from different tools.
Anomaly Detection
AI learns what “normal” looks like for your data — normal traffic, normal conversion rates, normal revenue — then alerts you when something deviates significantly. This sounds simple, but it is surprisingly hard to do manually. Your traffic might spike every Monday and drop every weekend. A 30% drop on a Tuesday is alarming. A 30% drop on a Sunday is normal. AI learns these rhythms and only flags true anomalies.
I get an email from GA4 every week listing the top anomalies. Last month, it flagged a 45% drop in traffic from one specific country. I would not have noticed this manually because total traffic looked fine — other sources compensated. But that country was my second-largest market. I investigated and discovered a local competitor had launched an aggressive ad campaign. I adjusted my own targeting in response. Without the anomaly alert, I would have lost ground for weeks before noticing.
Predictive Analytics
AI uses historical data to forecast future outcomes. Will your revenue grow next quarter? Which customers are likely to churn? What inventory levels do you need for the holiday season? These are not guesses. They are statistical projections based on patterns the AI has identified in your past data.
The accuracy depends heavily on data quality and quantity. A new website with three months of data will get unreliable predictions. A business with three years of clean transaction data will get forecasts that are genuinely useful for planning.
I use predictive analytics cautiously. It is helpful for directional guidance – “revenue will probably be flat or slightly up” – but I do not bet the business on exact numbers. The AI does not know about your upcoming product launch or your competitor’s new feature. It only knows what happened before.
Natural Language Queries
Some tools now let you ask questions in plain English instead of writing SQL or building pivot tables. “Show me which blog posts had the highest engagement time from users in California last month.” The AI translates your question into a database query, runs it, and presents the results.
This is the feature that finally made analytics accessible to me. I do not know SQL. I do not want to learn SQL. I want to ask a question and get an answer. Tools like Tableau Ask Data, Microsoft Copilot in Fabric, and even some GA4 reports offer this capability.
The limitation is that the AI only understands questions about data it has access to. If you have not configured event tracking for newsletter signups, asking “how many people signed up for my newsletter” will return nothing or garbage. The AI cannot analyse data you have not collected.
Automated Insights
This is the feature that surfaces interpretations without you asking anything. The AI scans your data continuously and generates sentences like “Your checkout completion rate is 12% below the industry average” or “Users who watch your tutorial video are 2.5 times more likely to make a purchase.”
These insights vary in quality. Some are genuinely useful. Others are obvious or irrelevant. I treat them as starting points for investigation, not conclusions. If the AI says my checkout rate is below average, I dig into the funnel to understand why. The AI points me in a direction. I still have to do the walking.
Tools That Actually Include AI Analytics
Here are the tools I have personally used or evaluated. I am not affiliated with any of them. This is based on my own testing and frustration.

Google Analytics 4
GA4 includes AI-powered insights, anomaly detection, and predictive metrics like purchase probability and churn probability. The insights are free and surface automatically in the interface. The predictive metrics require a minimum volume of data — typically hundreds of events per day — to become reliable.
My experience: the automated insights are genuinely helpful for spotting trends I would miss. The predictive metrics are less reliable for small sites. My blog does not generate enough e-commerce events for purchase probability to be meaningful. It works better for larger e-commerce sites.
Microsoft Fabric with Copilot
Microsoft’s analytics platform integrates AI across data ingestion, transformation, and visualisation. Copilot lets you ask natural language questions about your data and generates visualisations automatically. It is powerful but has a steep learning curve. The setup is not trivial.
I experimented with Fabric for a client project. The natural language queries worked well for straightforward questions. Complex questions – “compare revenue per user across customer segments while controlling for seasonality” – still required manual configuration. The AI helps, but it does not eliminate the need to understand your data model.
Tableau with Einstein Discovery
Tableau’s Einstein Discovery feature builds predictive models from your data and explains which factors drive outcomes. It is enterprise-grade and expensive, but the explanations are more transparent than most AI tools. Instead of a black box prediction, it tells you, “Revenue is driven 34% by customer tenure, 28% by campaign type, and 19% by discount level.”
I have only used this through a client’s licence. For small businesses, the cost is hard to justify unless data is central to your operations.
Notion AI and Airtable AI
These are not traditional analytics tools, but they include AI features for analysing databases. Notion AI can summarise project data, extract action items, and answer questions about your content. Airtable AI can classify records, generate summaries, and flag anomalies.
I use Notion AI for content planning – analysing which blog post topics perform best based on my own tracking spreadsheet. It is not sophisticated analytics, but it is accessible and fits my workflow.
| Tool | Best For | AI Features | My Honest Take |
|---|---|---|---|
| Google Analytics 4 | Website owners, small businesses | Anomaly detection, predictive metrics, automated insights | Free, helpful insights and predictive metrics need volume |
| Microsoft Fabric | Mid-size businesses with data teams | Natural language queries, automated pipelines, Copilot | Powerful but complex setup, not for beginners |
| Tableau + Einstein | Enterprises with dedicated analysts | Predictive models with transparent explanations | Excellent but expensive, overkill for small sites |
| Notion AI | Solopreneurs, content creators | Database summaries, content analysis | Lightweight, fits existing workflows, not deep analytics |
| Airtable AI | Teams managing structured data | Record classification, anomaly flagging | Good for operational data, not traffic analysis |
What I Learned the Hard Way About Data Quality
AI analytics is only as good as the data you feed it. This sounds obvious, but I learned it through painful experience.
In 2024, I set up GA4’s predictive metrics for my blog. The AI started predicting which users were likely to return within seven days. The predictions looked reasonable — 60% accuracy, 70% precision. I was excited. Then I noticed something odd. The model was predicting return visits for users who had already returned. The data pipeline was delayed by 24 hours, so the AI was training on stale data and making predictions about events that had already happened.
The fix was simple — adjust the data freshness settings — but it took me a week to notice the problem. During that week, I made content decisions based on predictions that were essentially random. I published two blog posts targeting audiences the AI identified as “high intent”. Those posts performed poorly because the audience identification was wrong.
The lesson: never trust AI insights blindly. Always sanity-check them against what you know to be true. If the AI says your best traffic source is a channel you have never invested in, investigate before reallocating budget.
Another hard lesson: AI amplifies bias in your data. If your historical data reflects past decisions that discriminated against certain customer segments, the AI will learn those patterns and recommend continuing them. I have not experienced this personally, but I have read enough case studies to know it is real. Audit your data for fairness before letting AI make recommendations that affect people.
How to Start Without Drowning
If you are new to analytics, the volume of tools and features is overwhelming. Here is the approach I wish someone had given me two years ago.
Step one: get one source of clean data. Do not try to integrate five platforms on day one. Pick one — GA4 for websites, Shopify analytics for e-commerce, HubSpot for CRM — and make sure the data is accurate. Fix your tracking setup. Verify that events fire correctly. Clean data beats fancy AI every time.
Step two: enable automated insights and read them weekly. Do not act on them yet. Just read them. After four weeks, you will start recognising which insights are consistently useful and which are noise. For me, traffic source anomalies and engagement time trends are reliable. Demographic breakdowns are usually irrelevant for my content.

Step three: ask one natural language question per week. “Which pages do users from organic search spend the most time on?” “What time of day do I get the most conversions?” Keep the questions simple. The goal is not to become a data scientist. The goal is to build intuition about what questions are worth asking.
Step four: act on one insight per month. Not ten. One. Change your headline strategy based on engagement data. Adjust your posting schedule based on traffic patterns. Test one landing page variation based on funnel analysis. Small, consistent actions compound. Big, sporadic overhauls do not.
I followed this approach for six months. By month three, I was checking analytics daily instead of avoiding it. By month six, I had doubled my email subscriber rate by focusing on the traffic sources and content types the AI consistently flagged as high-performing. I did not become a data expert. I just became someone who pays attention to the right signals.
When AI Analytics Is Not the Answer
AI analytics is powerful but not universal. There are situations where it adds little value or actively misleads.
Small data volumes. If your website gets 50 visits per month, AI cannot find meaningful patterns. The sample size is too small. The insights will be random noise dressed up as intelligence. Focus on qualitative feedback and direct conversations instead.
Rapidly changing environments. If your business model, audience, or competitive landscape shifts frequently, historical data becomes a poor predictor. The AI learns from the past. When the past stops resembling the future, predictions fail. I experienced this during a platform algorithm change. The AI kept recommending strategies based on old traffic patterns that no longer applied.
High-stakes decisions. AI analytics is a tool for prioritisation and exploration, not for betting the company. Do not fire your marketing team because an AI model predicts low ROI. Do not invest your life savings based on a revenue forecast. Use AI to inform judgement, not replace it.
Complex ethical decisions. AI can tell you which customer segment is most profitable. It cannot tell you whether targeting that segment is fair, sustainable, or aligned with your values. Those decisions require human judgement.
Related Articles
- How Small Businesses Can Use AI Analytics
- Predictive Analytics with AI: A Simple Introduction
- AI Data Visualization Tools Compared
- How to Use AI for Spreadsheet Analysis
- How AI Tools Summarize Large Datasets Instantly
Sources and References
- Google Analytics Help. About Analytics Insights.
- Microsoft Learn. What is Microsoft Fabric?
- Tableau Help. Einstein Discovery in Tableau.
- Notion Help Center. Getting Started with Notion AI.
- Airtable. AI Features Overview.
Samira Patel writes about tech habits and tools that actually make daily work easier. She tests everything on her own devices and accounts before recommending it. When she’s not troubleshooting laptops, she’s reorganising her cloud storage for the fifth time.
All articles are independently researched and updated regularly. For questions or corrections, visit the Contact page.